rrg
A project that explores Copperas Creek Waterfall
in Red River Gorge National Geological Area
Created by Zina Merkin for Geography 409, Fall 2018
Introduction
This is a project for University of Kentucky, Geography 409, fall 2018. Using ArcGIS Pro, Python programming, Markdown language, and Visual Studio Code as tools, our task was to explore one or more geologic features in Red River Gorge, and document our analyses. A variety of data was accessed and analyzed; we made use in particular of the high quality LIDAR data made available through the Commonwealth of Kentucky’s Elevation Data & Aerial Photography Program KyFromAbove. Let’s begin by introducing you to the Red River Gorge Geological Area within the Daniel Boone National Forest.
(created in ArcGIS Pro)
Natural Features
The Red River Gorge has numerous natural features of interest, including many streams feeding the Red River, with captivating waterfalls and plunge pools. There are many rock arches and rock shelters or overhangs. A rich diversity of plant life fills the many different microclimates and habitat niches in the gorge.

Natural Bridge Arch
Source: Federal Highway Administration, Red River Gorge Scenic Byway website
Heritage Features
The Red River Gorge has both archaeological and historical features within it. Rock shelters were used by prehistoric people, and, if undisturbed, may contain clues to their culture. Camping, digging, and firebuilding are prohibited in rock shelters in the Gorge and the rest of the Daniel Boone National Forest. Gladie Historic Site features a reconstructed cabin from the late 1800s, interpreting aspects of life in that era.

Map of Gladie Historic Site
Source: Daniel Boone National Forest website
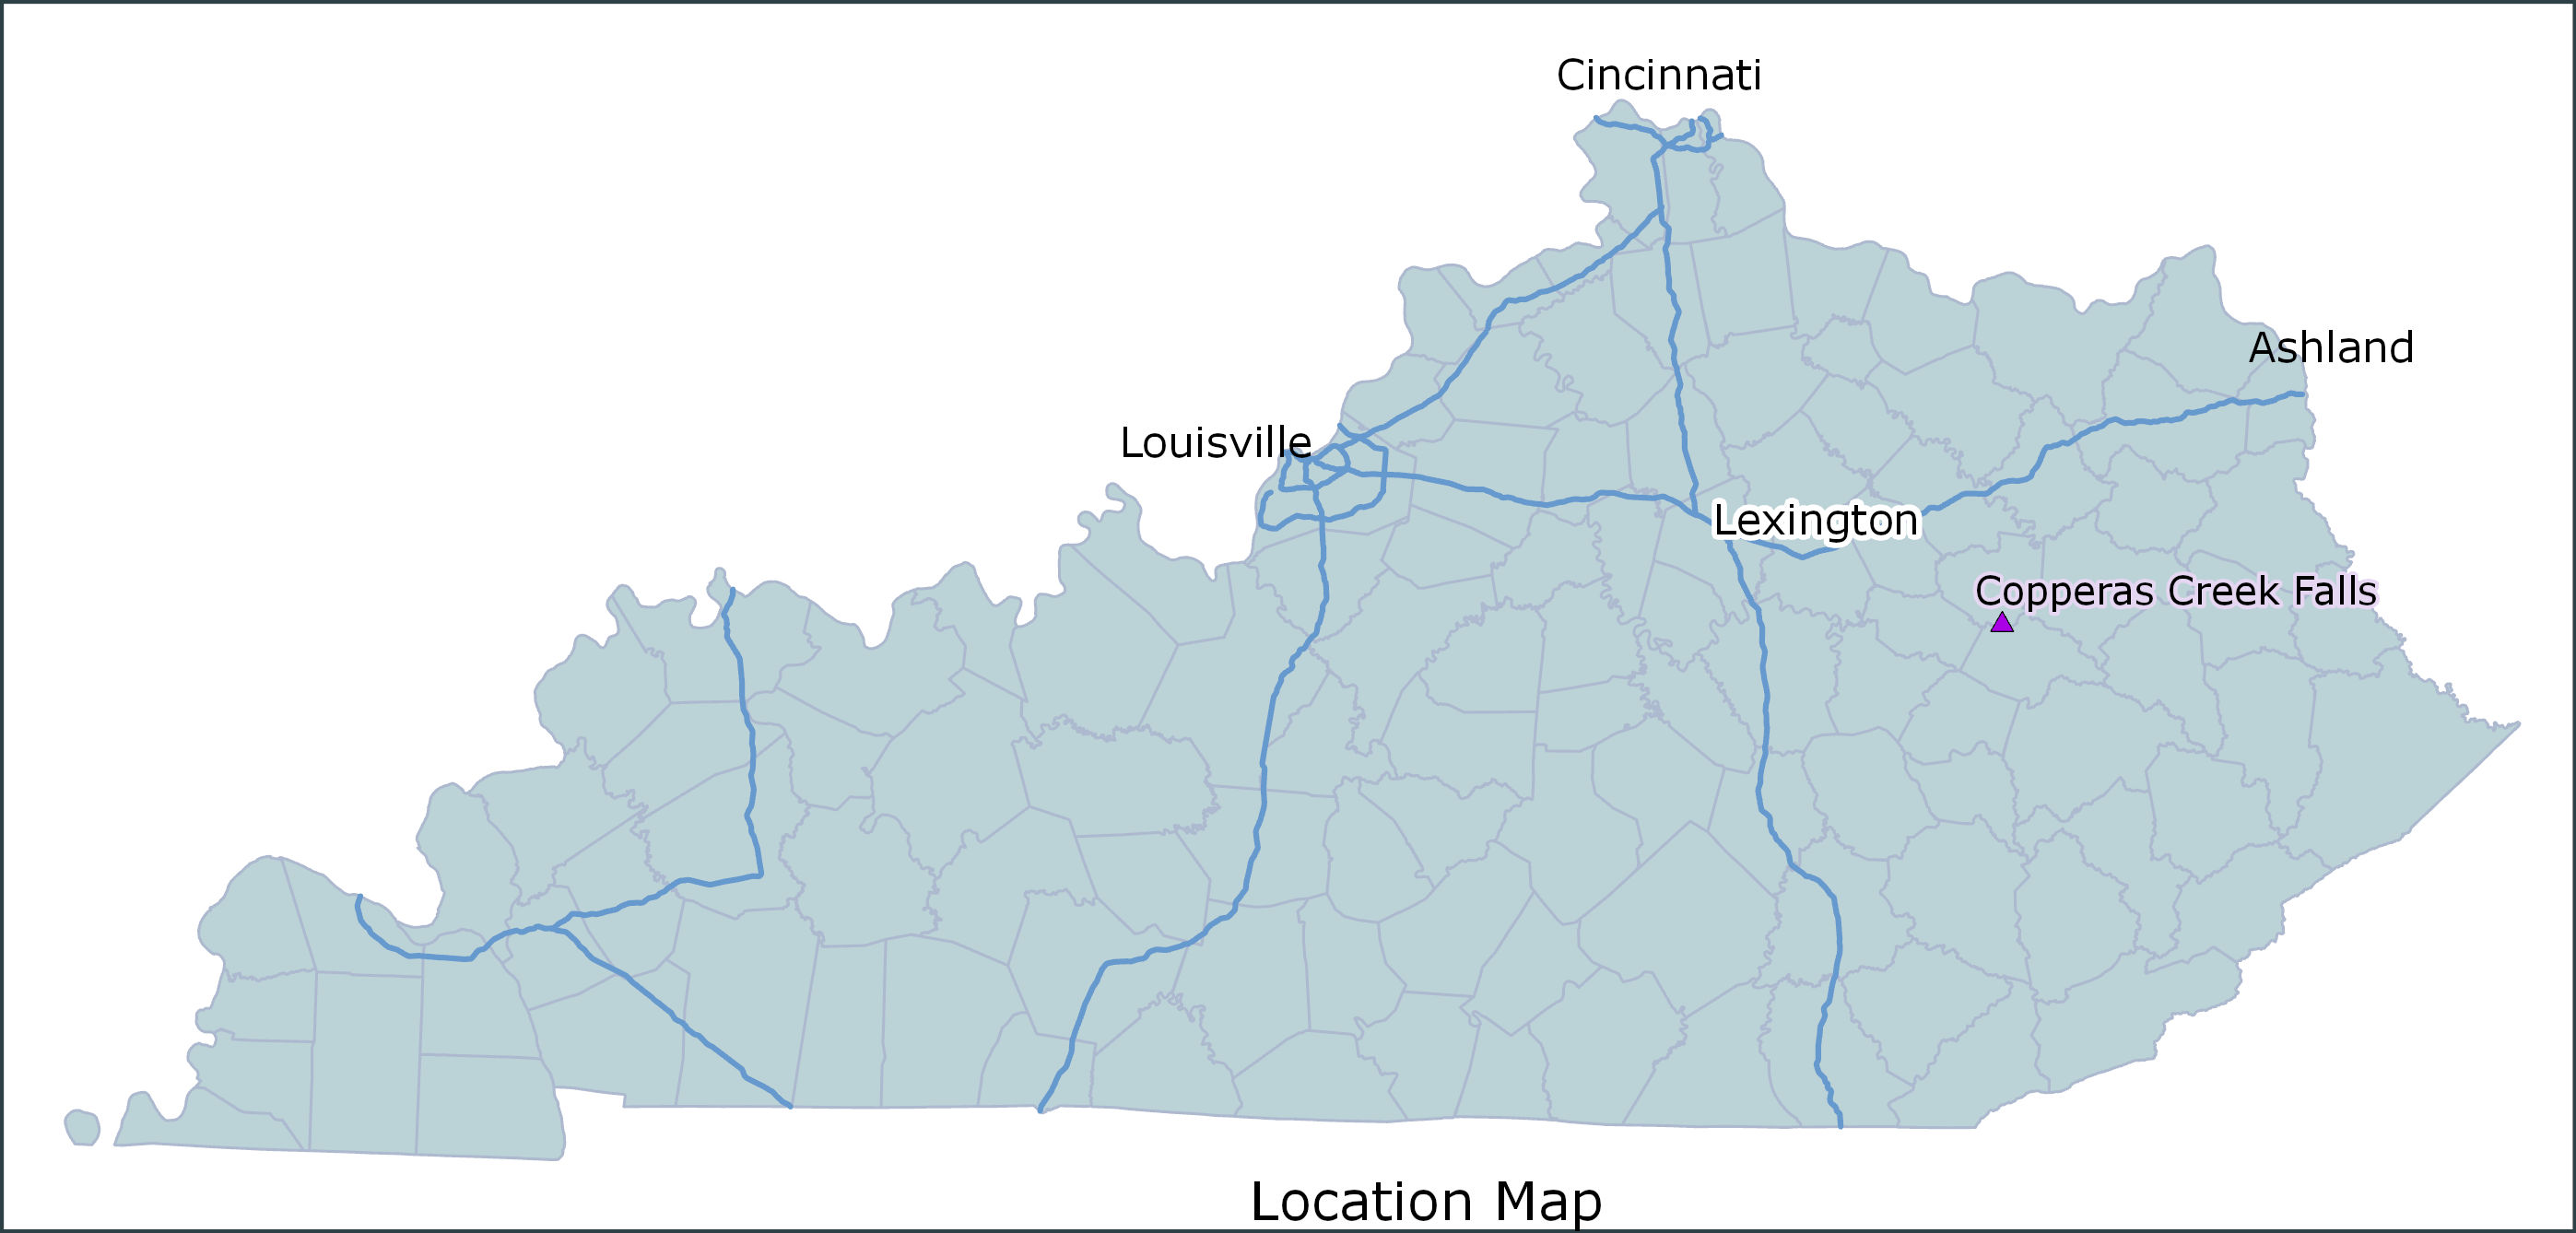
Explore Copperas Creek Falls
By following the links here, you can access the web pages which are the final products of this project. The first link will take you to a field report which describes the study site, along with photos.
The second link will take you to a page which shows results of terrain analyses done using the LIDAR data, including a fly-through video produced in ArcGIS Pro, and both static and dynamic maps.
Dynamic Map and Terrain Analyses
Project Components
ArcGIS Pro Work
ArcGIS Pro software was used both to create maps and to process several kinds of data. Digital Elevation Models were used to produce hillshade and contour derivatives. LIDAR point cloud ground returns also were processed into more detailed elevation products. Other point cloud returns were colored by underlying aerial photography images and used in the 3-D scene to simulate the forest. Other geoprocessing tools clipped data sets to the area of interest, and created derivative elevation change rasters which identified probable cliff areas. Text files with latitude and longitude fields were used to generate points for waterfall locations.
Maps produced included a location map, a geospatial pdf basemap for field work, a poster describing the elevation analyses, and an animation of a 3-D Scene which showed the subject feature from many angles.
Python Programming
Python coding in Jupyter Notebook was used to automate the clipping operations, as well as to generate hillshades at different azimuth angles. It was also used to extract rows of data, from a very large text file of national named features, for which the feature type was “Falls” and the state was “KY.”
Markdown and HTML
Project work was kept in GitHub repositories, and I used Markdown language to create “readme” files for the repositories, one of which is the document you are reading now.
Index.html files were created from a provided template, which was customized with different colors, fonts, and layout tags, and filled with content related to the project.
Mapbox
Mapbox was used to display some of the geographic products created, including contours, point locations of geographic features, and interpreted cliff areas.
Selected Data Sources
- Grid for LIDAR data location and LIDAR point cloud data from Kentucky From Above
- Aerial imagery from KY Statewide 2’ - 2016
- Stream data from Kentucky Geoportal extract of National Hydrography Dataset